How to Improve Flask Performance With Flask Debug Toolbar
Improving Performance
In web applications, performance is actually a feature that will improve the overall usability of your product and influence the success of your project. Pages that are slow to load lead to frustrated users and can result in users abandoning your site. The Google search ranking algorithm now explicitly accounts for the performance of web pages. In e-commerce applications, like Yumroad's storefronts and product page, page speed is directly linked to the bounce rate of visitors. A study by the analytics company CrazyEgg, found that a one second delay leads to a 16% decrease in customer satisfaction and a 7% decrease in conversions. Pinterest, an online discovery tool, was able to increase their sign-ups by 15% and increased their organic search traffic by reducing the perceived waiting time for users.
There's a three step process to improving performance in your web application: Measure, Optimize, and Cache. We will go through each step within Yumroad and measure our improvements as we go along.
Measurement
There are a few core metrics we want to measure when it comes to performance: the time it took Flask to render a response, the amount of time Flask spent to query the database, and what queries SQLAlchemy issued to the database. While it's possible to measure all of these manually on a one-off basis, in order to continually measure and optimize this as we continue to develop our application, we will need to integrate these measurements into our development workflow.
Flask Debug Toolbar
Flask-DebugToolbar provides all of this information and embeds it into a helpful toolbar accessible in our development environment.
Set it up by adding flask-debugtoolbar to the requirements.txt file and then initializing it.
Within yumroad/extensions.py, initialize the extension.
from flask_debugtoolbar import DebugToolbarExtension
...
debug_toolbar = DebugToolbarExtension()
By default, in addition to adding additional content to the page, the debug toolbar intercepts redirects and presents an HTML page detailing the redirect, so we will will disable that in our test configuration. If you find redirection interceptions are not useful, you can also disable it in your development environment.
In yumroad/config.py, add the following settings:
class DevConfig(BaseConfig):
    DEBUG_TB_INTERCEPT_REDIRECTS = False # Optional

class TestConfig(BaseConfig):
    DEBUG_TB_ENABLED = False
Now in yumroad/__init__.py, you can initialize the application. By default, the debug toolbar will only load when Flask is set the debug mode (which happens in the development environment by default)
from yumroad.extensions import (..., debug_toolbar)

def create_app(environment_name='dev'):
    ...
    debug_toolbar.init_app(app)
    ...
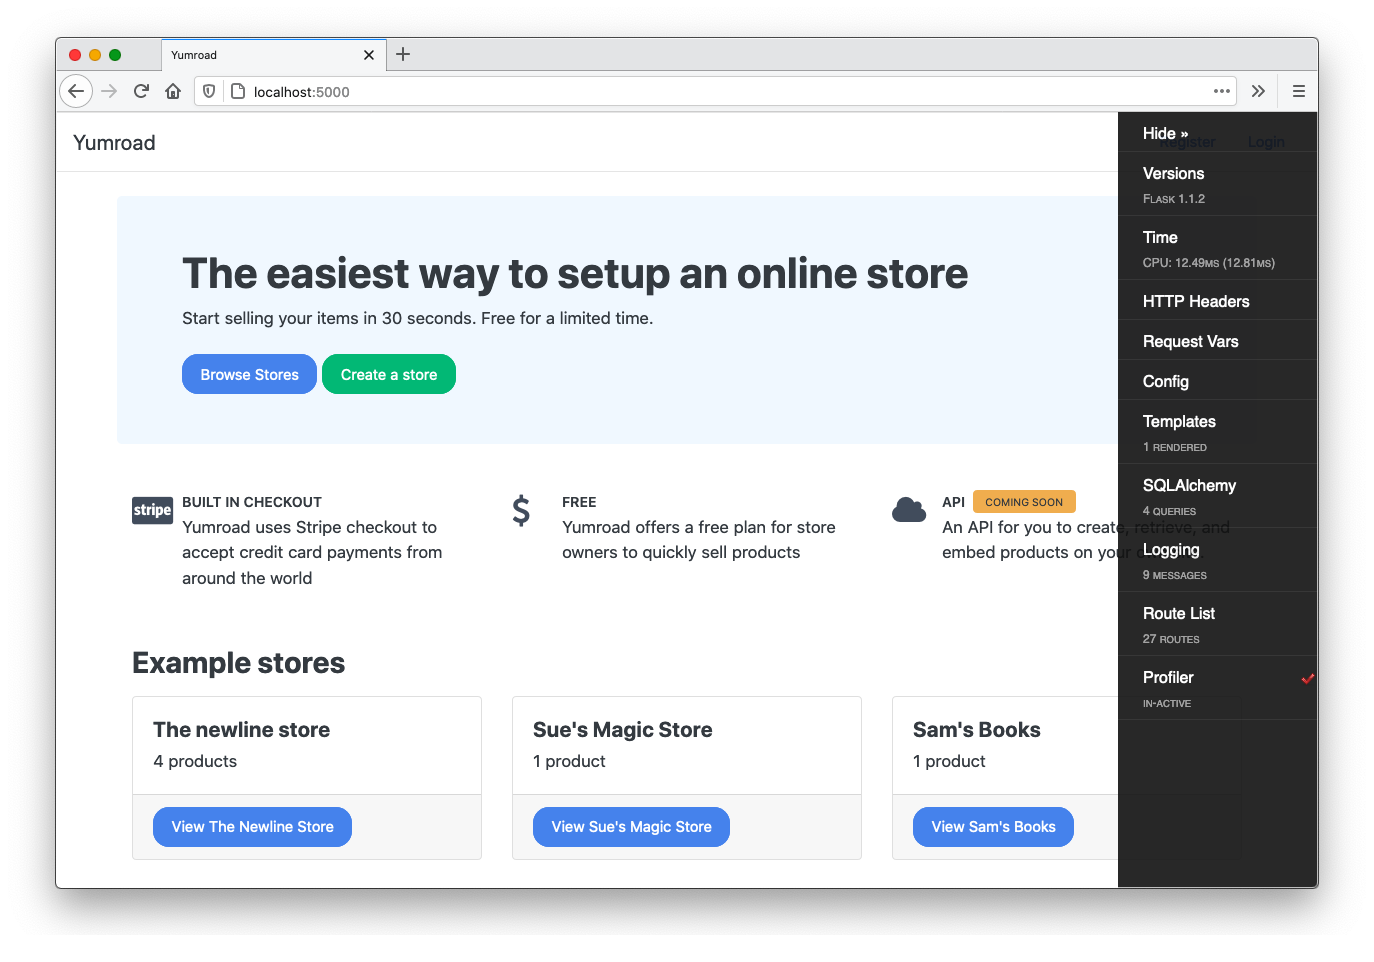
Now when you run your application (flask run) in development mode, you will see a toolbar that you can hide on the right side of your application. Flask-DebugToolbar injects HTML into the templates that are rendered to add this to our pages.
When the toolbar is hidden, it looks like this:

The full toolbar comes with a complement of tools:
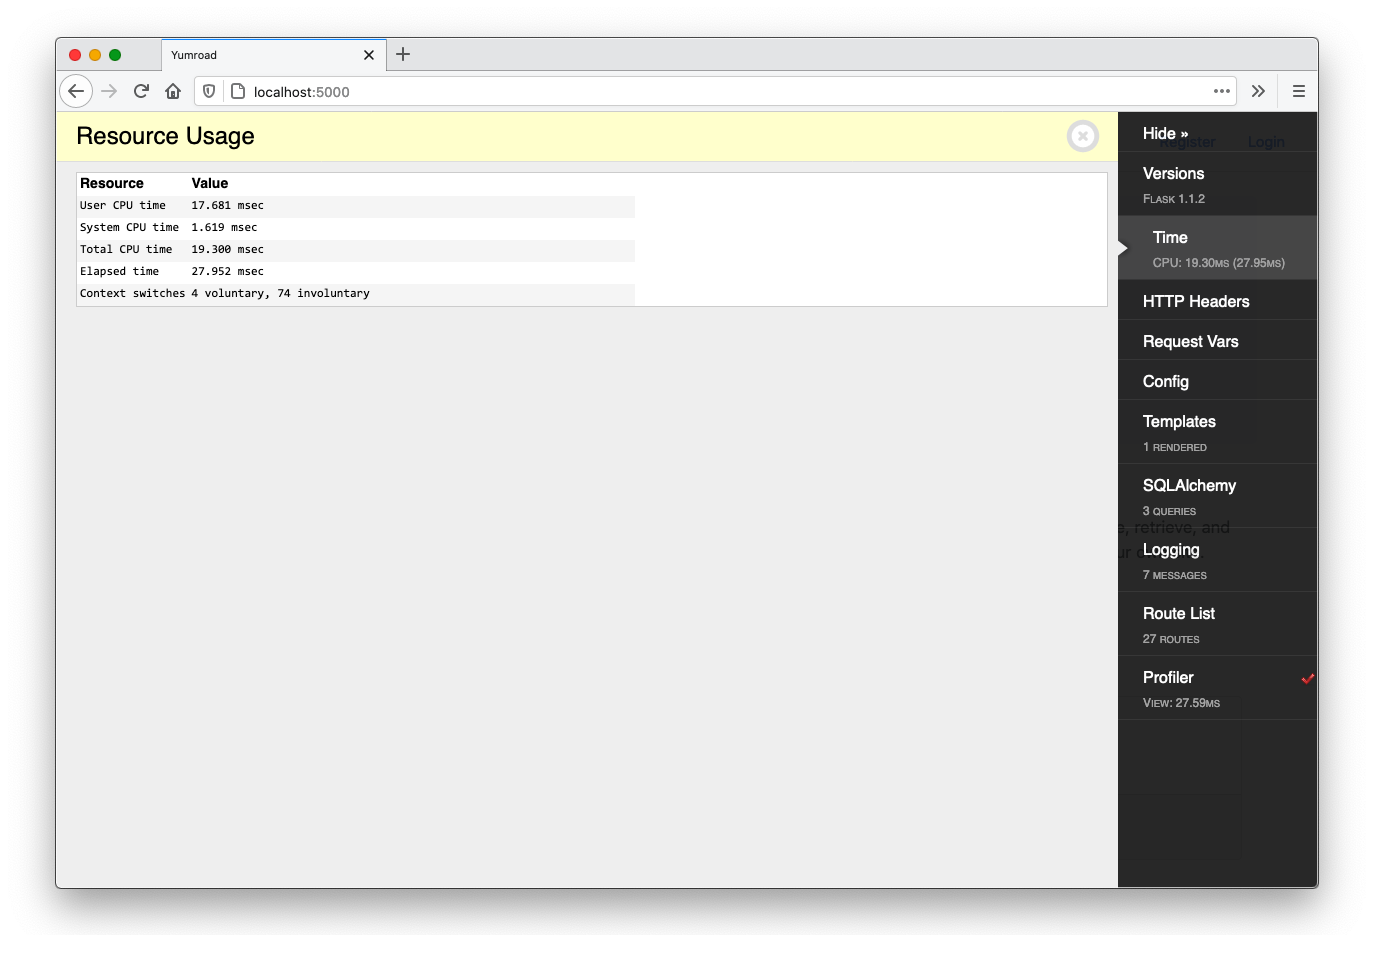
Under "Time", we can see the time it took to render the page (19 ms in this case) and clicking into it gives us more details about the time it took to render the page.
The toolbar also gives us the ability to profile the execution of requests and get a detailed trace of where Flask was spending time. By default, it is not enabled, but if you click on "Profiler" it becomes enabled and will start tracing future requests. Once it's enabled, if you refresh the page and pull up the Profiler again, you will see a detailed trace of where Flask was spending time.
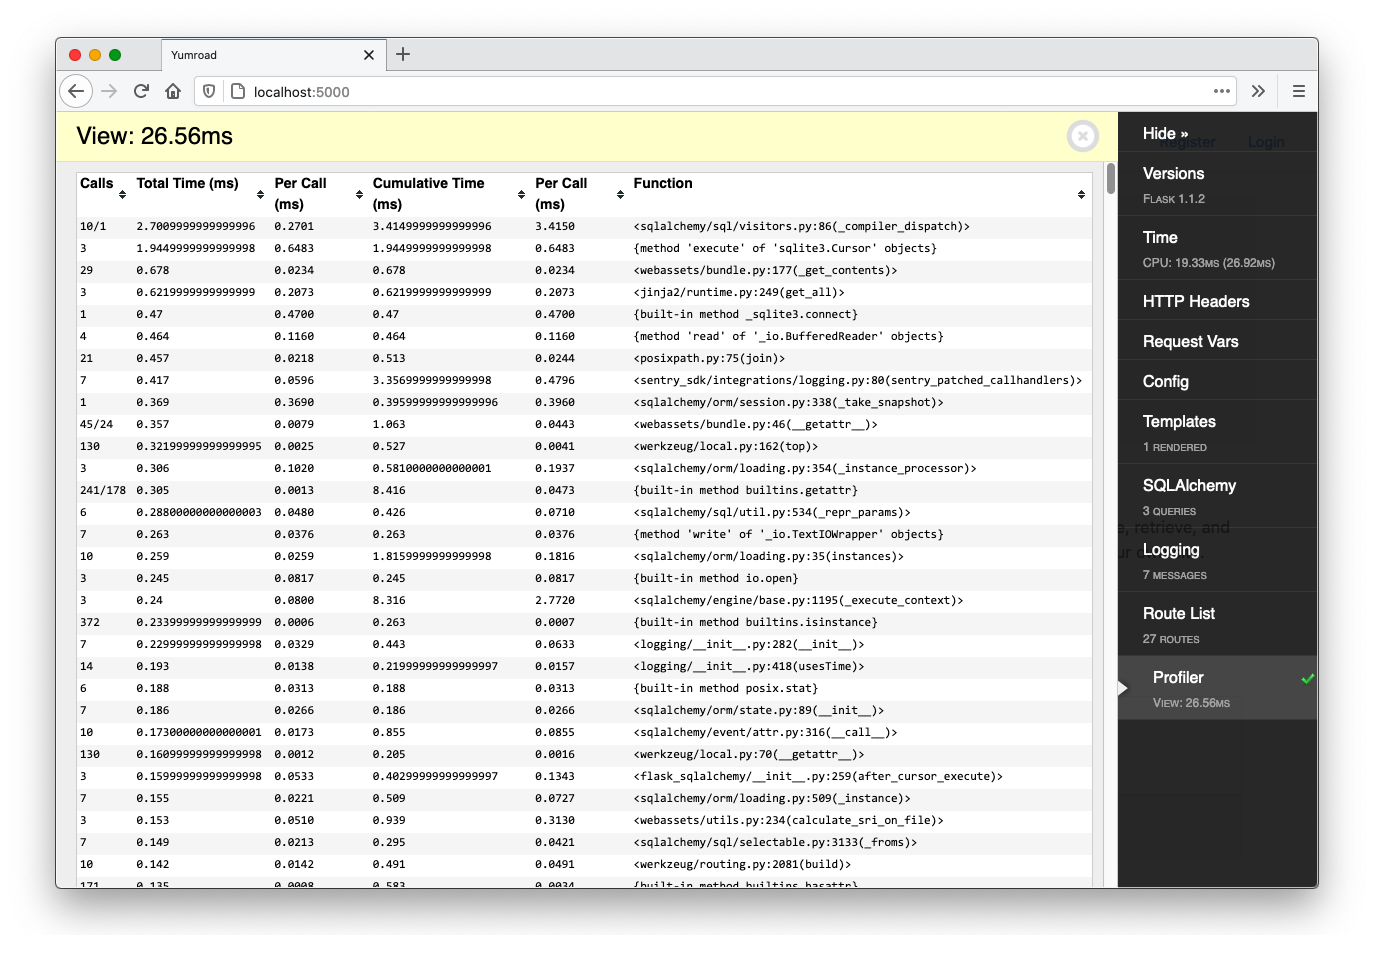
This becomes very useful if you want to focus on optimizing any functions within your own application that are a bottleneck. In this trace, everything seems pretty fast, but in practice a lot of web application optimization comes from thinking about database usage.
To do check how well we are doing on the database front, we'll have to look at the actual queries that SQLAlchemy issued. The SQLAlchemy tab will show us what queries are being issued, how long they took, and what lines are triggering them. The landing blueprint in blueprints/landing.py simply grabs up to three stores, and renders them alongside a count of the number of products.
@landing_bp.route('/')
def index():
    stores = Store.query.limit(3).all()
    return render_template('landing/index.html', stores=stores)
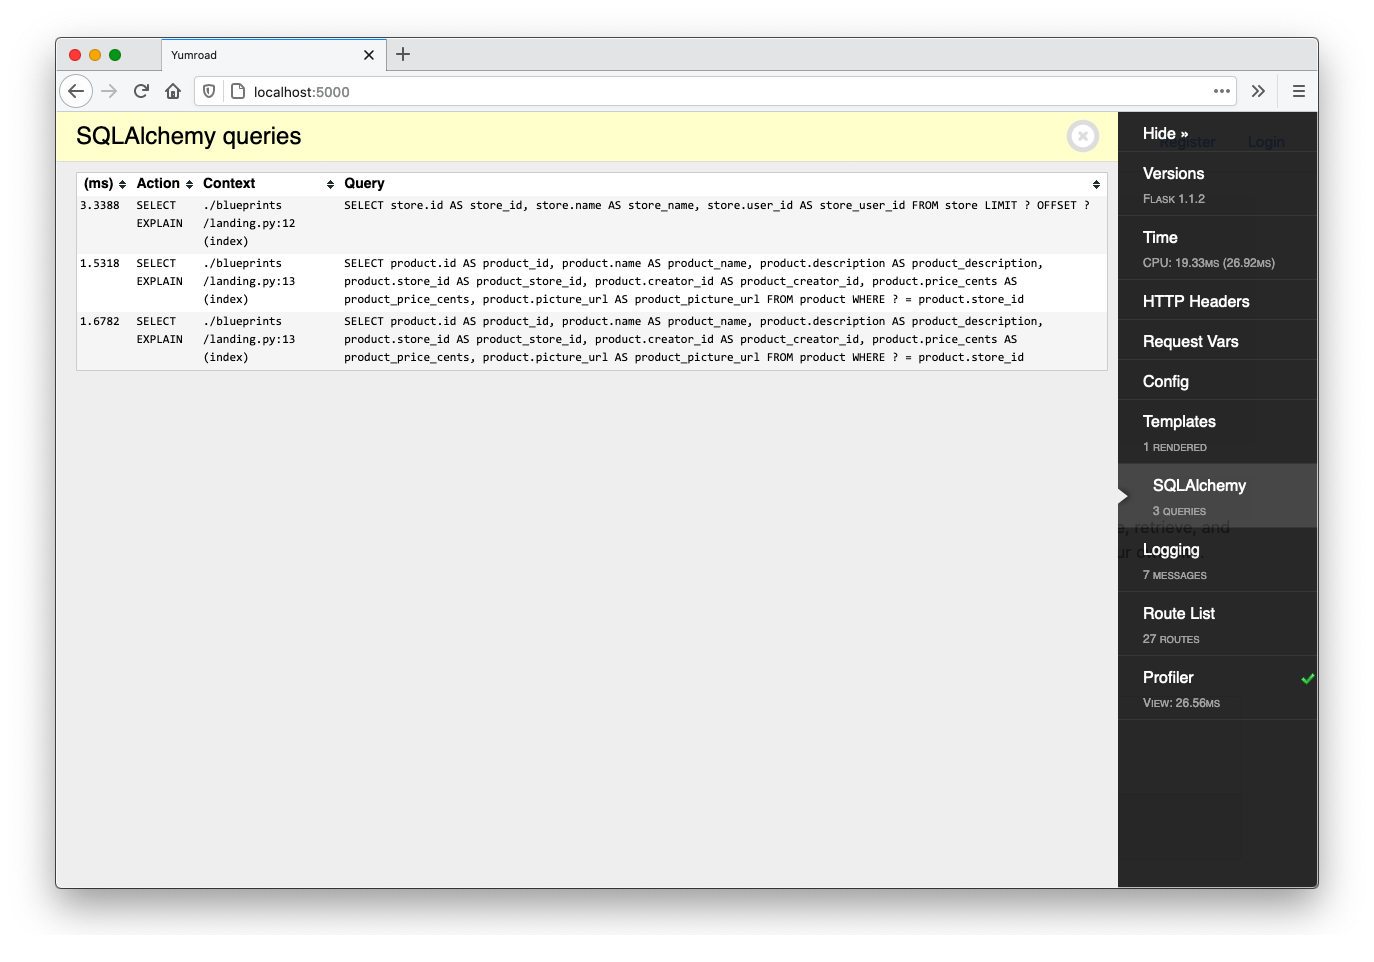
If we limit our query to a single store, the queries tab looks like this:
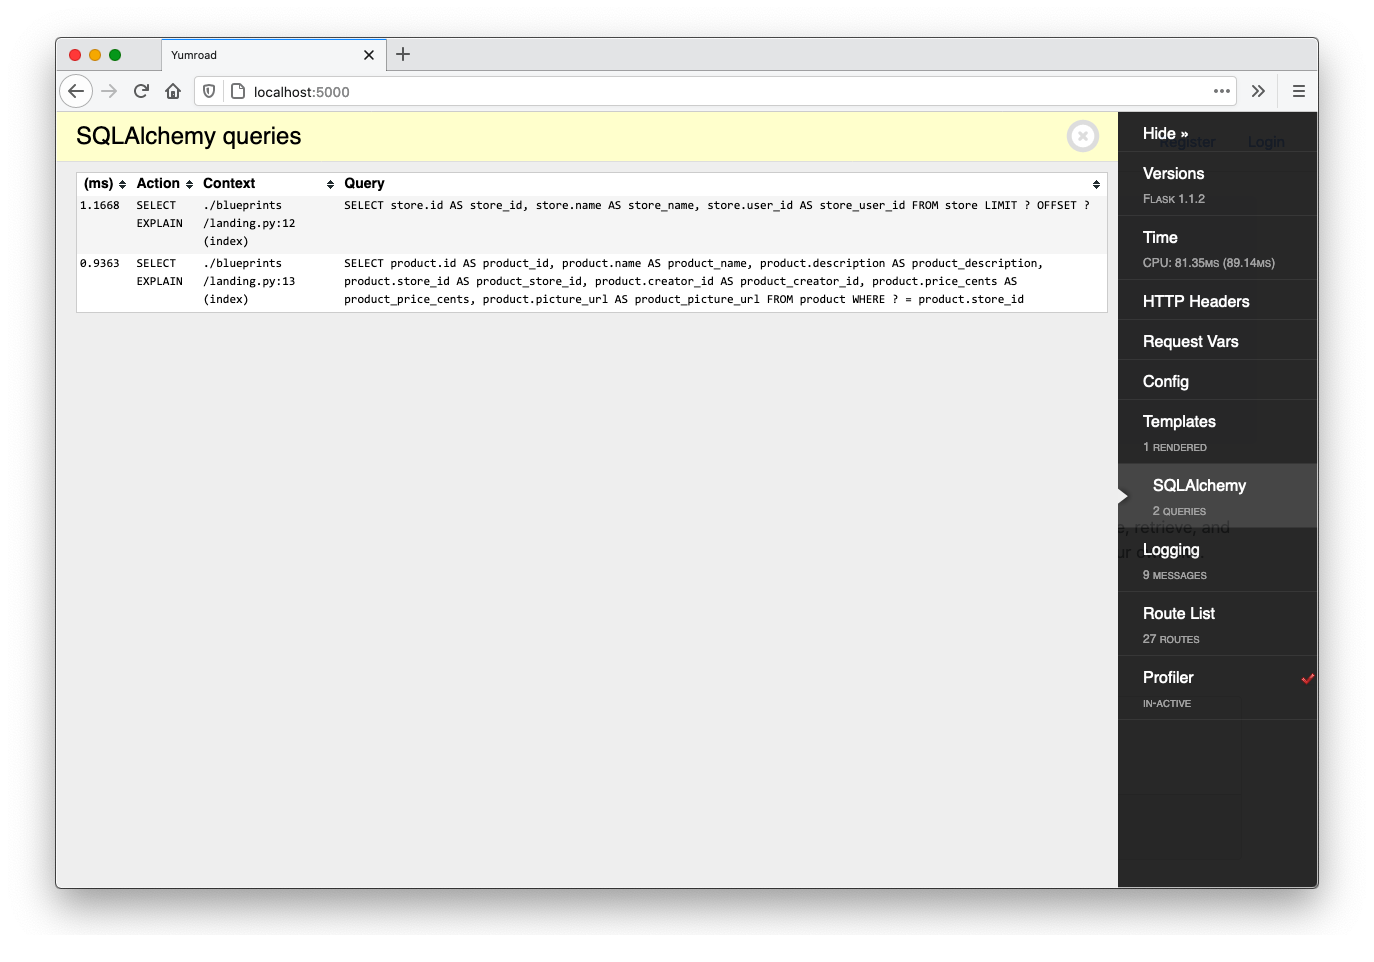
If I change the login in the landing route to render all three of the stores in my local database, the queries tab, looks like this.
The query to the Users table occurs as part of the call to render_template (according to the context column in the log above). For every store we render on the homepage, we access the user of the store and we'll need to issue a new query to get that user's email address.
This is known as the N+1 anti-pattern.
The N+1 Problem
Why is it called N+1? In this example, if we had
Nstores, we would issue one query to fetch all of the stores, andNqueries to the User table. The total number of queries would be N+1. This will slow down your application as you will need to issue a lot of queries and wait for a response to each one.
Since databases are often not on the same machine as the web server and must communicate the network, it introduces a lot of unnecessary latency.
N+1s in the real world. Imagine you are cooking a recipe and for each ingredient ingredient you stopped everything you were doing, ran to the grocery store, and only got that specific ingredient, and then came back only to repeat the same process for every ingredient. It'd be painfully slow. Instead to optimize that process, you would want to get a list of everything you need and purchase all of the necessary ingredients at once.
To resolve this N+1 problem, we need to tell SQLAlchemy to load the User table through a join when loading the Store query. One way we can do that is to do what we did for Product, by specifying that the relationship should be loaded via a join (instead of being lazily loaded only when we attempt to access the user attribute, like it is now). The types of loading patterns that are available to are detailed within SQLALchemy documentation for relationships.
We will need to tell SQLAlchemy to perform a joined load on the user relationship. To do that we will import joinedload from sqlalchemy.orm and pass it in as an option to the query.
from sqlalchemy.orm import joinedload

from yumroad.models import Store
...
@landing_bp.route('/')
def index():
    stores = Store.query.options(
        joinedload(Store.products)
    ).limit(3).all()
    return render_template('landing/index.html', stores=stores)
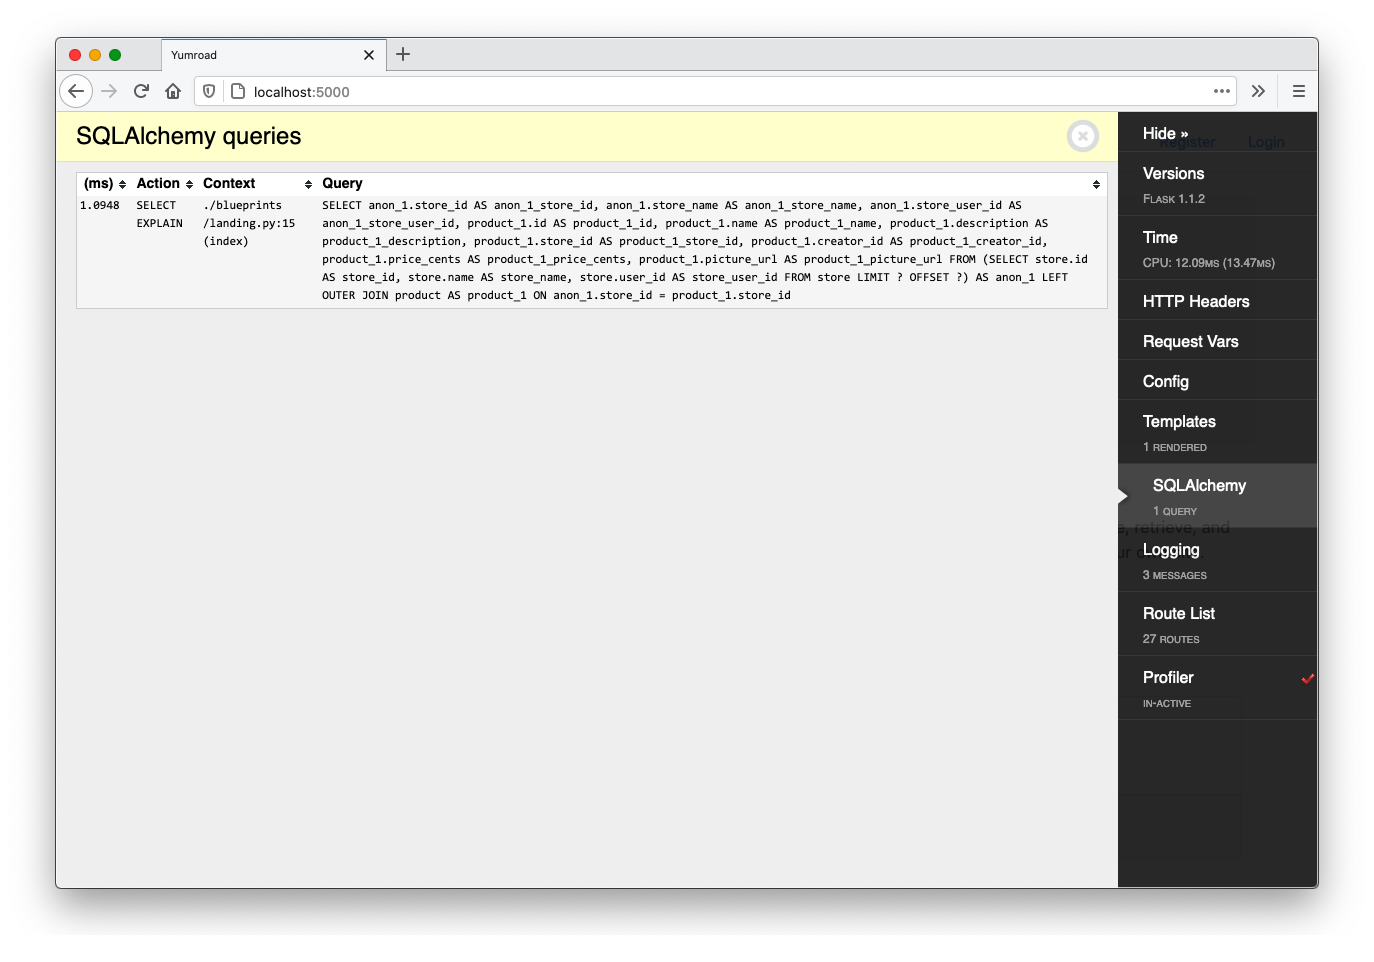
Once we make this change, we see that we are now only executing one query and have improved the page load speed.
A common point of confusion is why we don't just use a normal join like we saw earlier in Chapter 9, and why we have to use a joinedload that results in a slightly more complicated query.
The issue is that adding a join to a SQL query can result in the results being substantially different than without a join.
For example Store.query.all() would emit a SQL query similar to select * from store and the results might look like this:
| Store ID | Store Name |
|---|---|
| 1 | The newline store |
| 2 | Sue's Magic Store |
| 3 | Sam's Books |
If we however tell SQLAlchemy to issue a query using Store.query.join(Product).limit(3).all() or Store.query.join(Store.product).limit(3).all(), this causes an issue because we will see repeated rows for each product in each store. In our case, "The newline store" has four products, so it will show up four times in this query. The SQL query emitted is SELECT store.id AS store_id, store.name AS store_name, store.user_id AS store_user_id FROM store JOIN product ON store.id = product.store_id LIMIT 3, which produces something like this:
| Store ID | Store Name |
|---|---|
| 1 | The newline store |
| 1 | The newline store |
| 1 | The newline store |
Behind the scenes, each row in that table represents a product in "The newline store" . The product details do not show up since we didn't select for any of the attributes on the product table. Even if we do end up accessing the product attribute later in our code, SQLAlchemy will have to issue another query to get the associated products. We end up with two problems: incorrect data and we still have additional queries.
How would we load the joined table fields if we wanted to? We would need to tell SQLAlchemy about the relationship passing an option using the
contains_eagerfromsqlalchemy.orm. Example:Store.query.join(Store.products).options(contains_eager(Store.products))would emit something similiar toselect product.*, store.* FROM store JOIN product ON store.id = product.store_id
A joinedload is something that SQLAlchemy provides to solve this problem, by allowing us to not have to rewrite queries and instead having SQLAlchemy manage the complexity of figuring out how to manage the joins so that the intent of our original query still remains intact.
Our simple "pythonic" query, turns into a long SQL command that would be tedious to write by hand
    stores = Store.query.options(
        joinedload(Store.products)
    ).limit(3).all()
SELECT
   anon_1.store_id AS anon_1_store_id,
   anon_1.store_name AS anon_1_store_name,
   anon_1.store_user_id AS anon_1_store_user_id,
   product_1.id AS product_1_id,
   product_1.name AS product_1_name,
   product_1.description AS product_1_description,
   product_1.store_id AS product_1_store_id,
   product_1.creator_id AS product_1_creator_id,
   product_1.price_cents AS product_1_price_cents,
   product_1.picture_url AS product_1_picture_url
FROM
   (
      SELECT
         store.id AS store_id,
         store.name AS store_name,
         store.user_id AS store_user_id
      FROM
         store LIMIT ? OFFSET ?
   )
   AS anon_1
   LEFT OUTER JOIN
      product AS product_1
      ON anon_1.store_id = product_1.store_id
By default joinedload performs left outer joins, but you can configure it to perform inner joins, which could perform better in specific scenarios. We won't delve too deeply into the depths of SQL here, but suffice it to say that the interface SQLAlchemy provides can save you a lot of time in handcrafting queries and improving performance.
Isn't there a more efficient query here since we only end up using the count of products on the template?
Yes (only selecting the count of products directly within our SQL query) but if we do ever use product attributes (like we do on the store page), this relationship will come in handy.
Preventing N+1s
The performance impact of N+1 queries can be severe at scale. To automatically add warnings to your application, an open source extension called nplusone can automatically warm you about queries that appear to fall into the N+1 trap.
If you have a relationship where you imagine most of the queries involving it will reference the relationship, you can configure SQLAlchemy to avoid "lazyloading" and automatically do a joined load.
This lesson preview is part of the Fullstack Flask: Build a Complete SaaS App with Flask course and can be unlocked immediately with a single-time purchase. Already have access to this course? Log in here.
Get unlimited access to Fullstack Flask: Build a Complete SaaS App with Flask with a single-time purchase.

[00:00 - 00:09] In Web applications, performance can actually be a feature. Pages that are slow to load lead to frustrated users and can result in bottom line impacts to your business.
[00:10 - 00:26] In e-commerce applications like YumRoad Storefronts and Product Page, PageSpeed is actually directly linked to the bounce rate of visitors. A study by the analytics company Crazy Egg found that even a one-second delay led to a 16% decrease in customer satisfaction and a 7% decrease in conversions.
[00:27 - 00:43] Pinterest on the other hand was able to increase their sign-up by 15% just by reducing the perceived wait time for users. There's a three-step process that you can follow usually when you're optimizing performance in your web application, and those are measure, optimize, and cache.
[00:44 - 01:00] We're going to go through each step within YumRoad and measure our improvements as we go along. Now the few core metrics we want to use includes the time it takes, flash, render response, and the amount of time the flash spent in the database and which database gr aced the longest.
[01:01 - 01:15] It's possible to measure all of these on a one-off basis, but in order to continually measure and optimize these, we need to develop our application to have it built into the development workflow. What we're going to do is we're going to install something called the "flash debug toolbar."
[01:16 - 01:34] This is a tool I found really helpful in assisting and optimizing during the development process. What we're going to do is we're going to add "flash debug toolbar" to requirements.txt here, and then in extensions.py we're going to instantiate it.
[01:35 - 01:58] "flash debug toolbar" import debug toolbar extension. Then we're going to import it here and with YumRoad/init.py. This is debug toolbar.
[01:59 - 02:18] Now we're going to set up a few config variables, namely that in the dev config , we don't want the debug toolbar to intercept redirects. By default, it actually does that.
[02:19 - 02:30] Personally, I find that a little annoying. Next off in the test config, I don't want the debug toolbar to be enabled at all, so I can just disable that there.
[02:31 - 02:35] Great. Now we can boot up our application and see what it looks like.
[02:36 - 02:48] In our terminal, we're going to un-pip install-r requirements.txt. We're going to run our server.
[02:49 - 02:53] Let's go ahead and go in Firefox and check out what our page looks like. Okay.
[02:54 - 02:58] So, as you can see, there's this new toolbar that just popped up on the right- hand side. It's pretty useful.
[02:59 - 03:18] If we hide it, it looks like this, but otherwise it looks like this. You can see it shows us the time that it took, other useful information like the HTTP headers, the versions of libraries we're using, request variables, and templates along with SQL-Hocami queries.
[03:19 - 03:23] So, this is really interesting. There's a lot of queries happening here.
[03:24 - 03:32] It also shows us logs as well as a list of all of the routes, which are all very useful. We can even specifically profile our application.
[03:33 - 03:44] So, here I'm going to turn on the profiler by clicking on that green check mark , and then I'm going to refresh the page. Once I view the profiler, you can see that it tells me how much time we're spending within each thing.
[03:45 - 03:57] So, I can go ahead and sort by things that are taking the most time, and you can see where we're spending most time. So, we're spending a good chunk of this time in the templating engine, as well as by making queries.
[03:58 - 04:06] So, looking at our code on the query log, you can see that we're issuing about five queries. Now, that's a lot of queries.
[04:07 - 04:17] And our page is pretty simple. What happens if we go to our code and then change it so that we're only quer ying one store instead of three?
[04:18 - 04:24] All right. Now that I've changed it to one store, let's go back here and check the metrics .
[04:25 - 04:33] So, the first page will take a while after an app reload, but then we can check the query log and see. Now, it's down to three queries.
[04:34 - 04:50] And so, this is a telltale sign that we actually have what's called an n plus one problem. When we have three queries or three stores that we're querying for, and we have five queries, that's going to be a problem if we ever want to load more than that.
[04:51 - 05:03] So, we can think about having a better optimized query here to fetch all of the products associated with the store. So, what's happening here is we're selecting a store with limit three, right?
[05:04 - 05:11] And for every one of those stores, we're going to select all the products belonging to it. But there's no reason why we can't do that within one query.
[05:12 - 05:33] So, the manuscript has this in more detail, but we're going to go inside of this query on the scode and we're going to implement what's called a join the load. And the join load ideas, we're going to fetch everything at once in a single query.
[05:34 - 05:44] So here we can say store.query and what we can do is we can say dot options. And we want to say that we're going to do a join load on the store.products relationship.
[05:45 - 05:55] And so, once we say that we're going to need to do a join on that relationship, SQL, we will figure out all of the work involved to create a better query there. So, we've set that there.
[05:56 - 06:01] Let's go back into our browser and see what happens. So, I'm going to reload the page.
[06:02 - 06:07] And first off, you can see the page is way faster. Went from around 20 milliseconds to 6.55.
[06:08 - 06:12] Next we can see the queries. We're actually only doing two queries to load this entire page.
[06:13 - 06:17] So, that's a huge improvement. And you wouldn't want to write this query yourself by hand.
[06:18 - 06:26] So, SQL me is doing a lot of the hard work here. The manuscript has more details about join load versus joins.
[06:27 - 06:35] The short answer is join load is going to do a little more work to make sure you don't have to change how you think about the query. Okay.
[06:36 - 06:46] Now, one other thing you can do that's highly recommended is you're building a large application. You should build in an extension that automatically warns you anytime you introduce n plus one queries.
[06:47 - 07:01] So, there's an extension recommended in the manuscript called n plus one that you can check out. Now, we have some relationships in our database where anytime we're fetching them, we're actually probably going to fetch any related products as well.
[07:02 - 07:05] So, one example is the star page. So, I have some pretty bad data in here.
[07:06 - 07:21] But if you had a lot of stores with a lot of products, you might imagine that it just makes sense just by default to always fetch the products. So, what we can do on our models is go ahead and specify the type of joining we want.
[07:22 - 07:27] By default, SQL me does something called lazy loading. So, it's only going to fetch the query if we access the property.
[07:28 - 07:36] So, if we load a product, but we never call dot store on it, it's not going to issue a store query. And that's all pretty reasonable.
[07:37 - 07:49] But if we know for a fact that every time we load a store, we're more than likely to look for its products. What we can do is we can actually tell SQL me to not do lazy loading and instead always do joined loading.
[07:50 - 08:04] So, looking back on Firefox, in order to render this page, we have to do seven queries before. Basically, for every store plus the queries to load the page, that's quite a substantial number of queries.
[08:05 - 08:23] Now that we've changed store to always lazy load, let's go back into our store page and see what happens when we view this page again. So, I'm going to go to Firefox and refresh this page and you can see we drop the number of queries down to two queries again.
[08:24 - 08:29] And then that also applies on the store page as well. So even on the store page, we're only issuing one query.
[08:30 - 08:46] And that's because we told SQL me that we're probably always going to get the products whenever we fetch a store. If you find that you don't have n plus one issues, but your database queries are still taking too long, you might not be using database indices efficiently.
[08:47 - 08:58] An index on a database field makes it easy to query. In our models, we've already defined a few indices by our nature of setting the primary key.
[08:59 - 09:16] So that's a default index, but we can also specify indices within SQL alchemy and create them in our migrations. One good way you can check if you're properly using indices is you can go and check the explain on our queue dashboard, which will tell you about it.
[09:17 - 09:24] In order to check the explain query, you're going to have to turn off CSR protection in your development environment temporarily. Okay.
[09:25 - 09:39] So next up is one issue right now is that we're loading all of the products for a store and all stores all at once. And if there are hundreds of stores on Yumroad, that could slow down our page load time, only if that's because there's going to be a lot of images for the browser to load.
[09:40 - 09:51] So instead of loading every single store at once, we can just load 10 at a time and provide for a way for users to navigate to each page. Normally this would be really complicated if we were doing it all ourselves.
[09:52 - 10:05] And if we had to write raw SQL and manage limits and offset, thankfully flask, seek alchemy comes built in with a way for us to do this. First off though, let's create a bunch of products under a sample store and we 're going to run a script here.
[10:06 - 10:22] So we're going to open our shell and in it, we're going to import product. So from Yumroad, the models import DB and product.
[10:23 - 10:49] So we're going to say for I and range 100, we're going to go ahead and create some new products. So we're going to say P is equal to product and we're going to say name is equal to sample product, the format and we'll say this is five plus one and we'll give a description and we'll give it to the first store, why not and the creator ID of one.
[10:50 - 11:06] Okay, then we're going to have to do DB dot session dot add of that product and then at the very end, we're going to do DB dot session dot connect. Okay, so that inserted 100 products into our database.
[11:07 - 11:15] Let's go back into our browser and see what that looks like. So once we load up our page, we can see it's loading up quite a few products here.
[11:16 - 11:22] So that's just a massive page to load. Let's look at how we can paginate it now.
[11:23 - 11:37] Go back in our code, we're going to go ahead and look at the store page, which is where we're on and what we want to render is all of the products for a page. So instead of directly accessing the relationship there, we're going to create a new query.
[11:38 - 11:54] We're going to say that all of the products is equal to product dot query for all of this products in this store, we're going to access the dot paginate. And what paginate does is it takes in a page or accepts per page here.
[11:55 - 12:12] And so what we can do is we can actually say int page, and then we can specify a default argument here. So essentially it operates like this as if you had two routes here.
[12:13 - 12:22] And then for per page, we can say we're going to do 10 per page. Great.
[12:23 - 12:29] Now for products, we're going to pass in this pagination object. So this doesn't actually return a list of all items.
[12:30 - 12:35] It returns an object that contains a list of all items. So we're going to have to tweak our template to make that happen.
[12:36 - 12:53] So going back in our template for store dot show, instead of going through products, we're going to have to say it's products dot items. This is going to be able to handle that loop correctly, but what we're going to have to add now is pagination filters at the very bottom here.
[12:54 - 13:02] So what we want to build here is if the product pagination object has a previous page, we want to link to that. And if it has a next page, we want to link to that too.
[13:03 - 13:12] So here we can add a previous page and essentially it's just going to go to the previous page number. And we can make this a bullet list right that.
[13:13 - 13:19] Okay. And then similarly for has next, we can go ahead and add some things here.
[13:20 - 13:29] So instead of pre page, it's going to be next page and similar here. All right.
[13:30 - 13:36] So we're going to need to render this outside of the for loop there. And we're probably also going to want to make this a little prettier.
[13:37 - 13:47] So instead of rendering 10 items per page, let's go back into our code and render just nine. Since we're rendering rows of threes.
[13:48 - 13:54] Okay. And back in the doors page, let's go and make this pagination a lot prettier.
[13:55 - 14:04] So what I'm going to do is I'm going to place this with some bootstrap styled logic here. So bootstrap provides us a nav bar and provides us some pagination classes.
[14:05 - 14:12] So if we have a previous page, I'm going to show a link to the previous page. And that's what we're going to do here.
[14:13 - 14:24] And if we don't, that link's going to be disabled. And if the products pages exist, it's basically going to go through a bunch of pages up to two in front of the current page.
[14:25 - 14:31] And then if it has a next page, it's also going to store a link to the next page. Let's go and check out how that looks back in our browser.
[14:32 - 14:43] We can see that this renders too forward as well. So we can go one, two, three, and if we go here, it's going to go ahead and show us some previous pages.
[14:44 - 14:46] Okay. So this is pretty great.
[14:47 - 14:51] We can go all the way to the end and it will show us the right thing. Okay.
[14:52 - 14:57] So that's pagination. And that also really helps improve the speed of the page.
[14:58 - 15:08] The very last thing we're going to do is go ahead and go into caching. So caching is what we can do is we've measured our application, we've attempted to optimize things, but we still can't make them any faster.
[15:09 - 15:15] And so what we can do is we can store results temporarily. The way we're going to do this is by installing flask caching.
[15:16 - 15:28] And then in our terminal, we're going to go ahead and run pip install dash our requirements dot TXT. All right.
[15:29 - 15:41] Now that we've installed flask caching, we're going to go to extensions and set that up soon. And then we're going to initialize it here.
[15:42 - 15:45] And in the knit, we're going to set it up. Okay.
[15:46 - 16:01] And then going back into our config, we're going to configure how we cast up. So in dev config, it's fine if we cast stuff in memory.
[16:02 - 16:09] So I'm just going to call this simple. In our cast config, I really don't want to cache anything between tests.
[16:10 - 16:19] So we're just going to keep this null. And I'm also going to turn off the warning that comes when you said cache type to, you know, because I'm intentionally doing that.
[16:20 - 16:31] Then in production, what I want the cache type to be is red. I want it to store on our data store, not in a single web servers memory.
[16:32 - 16:38] And I'm going to call this yumroad and dash so we can identify what's in the cache if we ever need to look it up. Okay.
[16:39 - 16:51] So now that we've configured our config.py file, we can go ahead and enable caching. So we can actually use caching on specific functions or on routes.
[16:52 - 17:04] So for example, let's go and check our landing page and check the logic there. So if we want to cache this, what we could do is we could say from run, we owe dot extensions import cache.
[17:05 - 17:18] And if when we import the cache, what we can say is we can say cache dot cached and we can give it a timeout, maybe 60 seconds as a really short timeout. So let's go ahead and check in our browser.
[17:19 - 17:20] What happened now? Okay.
[17:21 - 17:25] So I'm on my browser and the first page load took 44 milliseconds. So you might be wondering, that's not that fast.
[17:26 - 17:34] But on the second page load, we reduced our time to 0.15 milliseconds, which is way faster. And that saves us a lot of time.
[17:35 - 17:38] But this is going to be an issue. Watch what happens when I log out.
[17:39 - 17:45] And then I go back into the homepage. It's actually rendering us the cached page from when I was logged in.
[17:46 - 17:52] And this is applies to anyone who visits our site. So that's going to be an issue where we're leaking data because we cache the wrong thing.
[17:53 - 18:02] So let's go ahead and fix that in our code. Here we're going to do something where we can cache the page if the user is not logged in.
[18:03 - 18:16] So what I'm going to do is I'm going to say from flask login import current user. And then on the cache call, I'm going to say, unless and then pass in a function here.
[18:17 - 18:23] So I'm going to use a lambda function, which is just a one-liner function. And we're going to say is authenticated.
[18:24 - 18:31] So it's only going to cache it if the user is not authenticated here. OK, that's a lot better.
[18:32 - 18:44] And if we do that, I feel a little more comfortable increasing the time out there. So going back, I'm going to log in as a user there.
[18:45 - 18:52] And then I'm going to load the homepage. So if I load the homepage every time, this still takes a substantial amount of time, but it's not bad.
[18:53 - 19:05] Now if I log out and check the homepage, I'm presented with the regular homepage, which is good. And on subsequent loads, the page load time is much faster.
[19:06 - 19:20] Now it's also possible to cache partials. So for example, if I wanted to cache a partial and all of the products in a store, what I could do is I could go into stores and add a cache block here.
[19:21 - 19:31] So here is an example. If I wanted to cache, I could cache by passing a timeout and a key along with some things that could append it into the key.
[19:32 - 19:43] However, I don't frequently find myself managing the cache in JINJA. There's a full list of ways you can manage the cache on the last caching documentation.
[19:44 - 19:53] So caching is a powerful tool that you can do to optimize the performance of your application. And there are a lot of other ways you can optimize the performance of your application as well.
[19:54 - 20:06] So there are some profilers here in your browser that will tell you things about how you're using your assets. When you deploy your application, you can test to make sure that your JavaScript and static files are loaded and configured correctly.
[20:07 - 20:17] But if you follow the best practices during development like avoiding n+1 queries, continually measure your application. You'll be able to easily develop the application that's performing enough for your goals.
[20:18 - 20:23] In the next chapter, we're going to talk about how to deploy our Flask application to a production environment.