How to Debug Errors in a Flask App With Werkzeug and Sentry
Now that we have a functional Flask application and know how to build out features, we want to deploy our application to production. We saw a brief example of deploying our simple stock ticker application in Chapter 1, but our application has become a bit more complex with a database, static assets, and configuration secrets. In this section, we will work through the steps to make Yumroad production ready, maintainable, and actually deploy it.
Errors
As much as we would like it to be the case (and despite all of the testing we do), our code will likely have some errors. In many large software products, engineers often spend more time fixing (or pro-actively preventing) bugs than actually building new features, so it's important to plan ahead for the developer experience if you want to create a maintainable Flask app.
To serve a production-grade use case it's important to make sure users understand that there was an error and store enough context for the errors so that you can find the root cause and fix it.
Using the Werkzeug debugger
In our local environment when we run into a bug as we use the site, we see the exception pop up in the browser and in our terminal and can try to fix it. Here is an image of the traceback from Flask (which even includes a handy debugger where we can try executing code courtesy of the Werkzeug library).
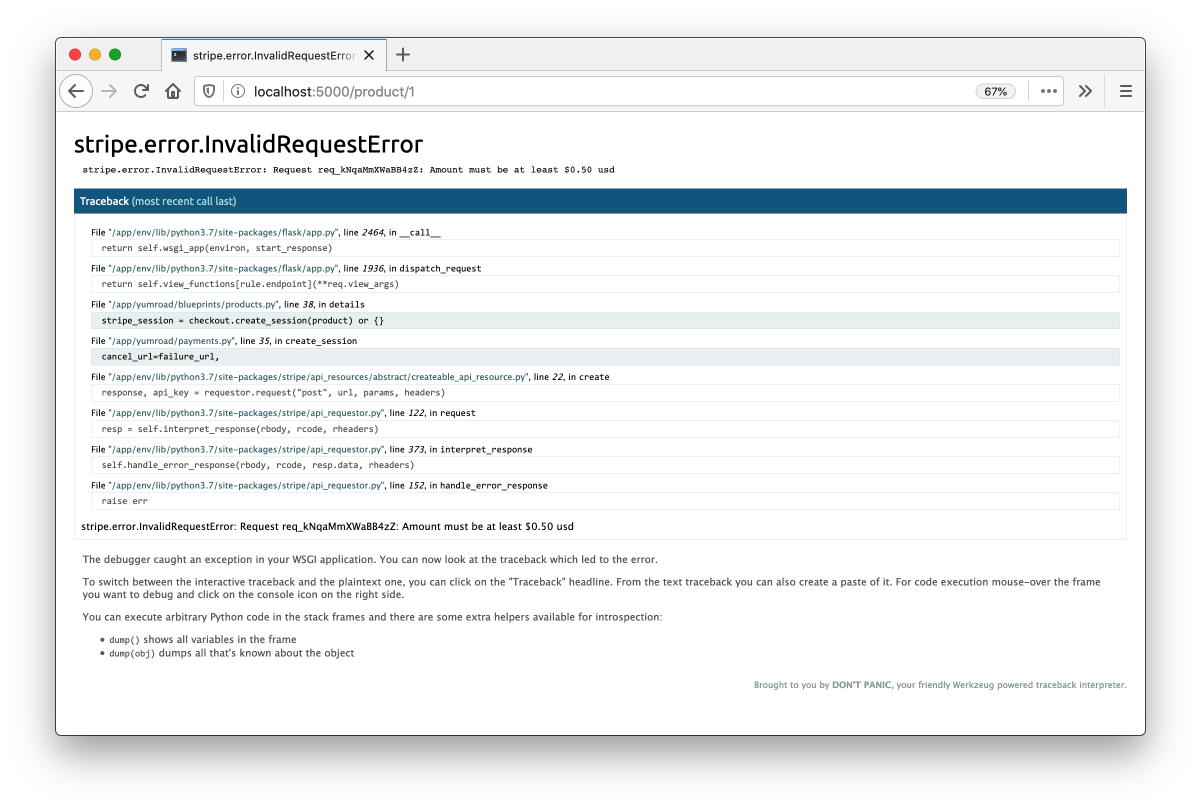
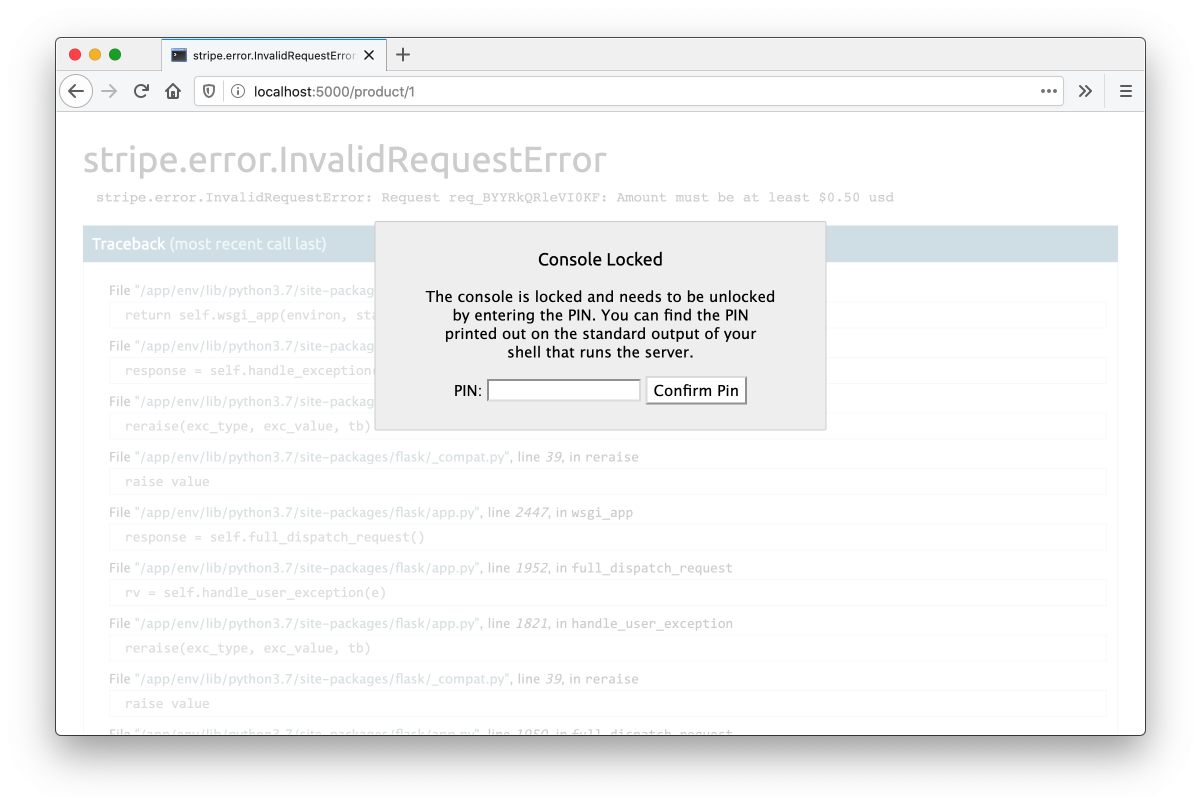
To use the built in debugger in Werkzeug, we need to first enter in the debugger pin when we first launch the Flask server in our terminal. This is for security reasons since otherwise we'd be letting anyone run code on our machine. This is also one of the reasons we tell Flask what kind of environment we are running through FLASK_ENV, so that we can disable the debugger in production. We wouldn't want just anyone to run arbitrary code on our servers.
$ flask run
 * Serving Flask app "yumroad:create_app" (lazy loading)
 * Environment: development
 * Debug mode: on
 * Running on http://127.0.0.1:5000/ (Press CTRL+C to quit)
 * Restarting with stat
 * Debugger is active!
 * Debugger PIN: 234-127-656
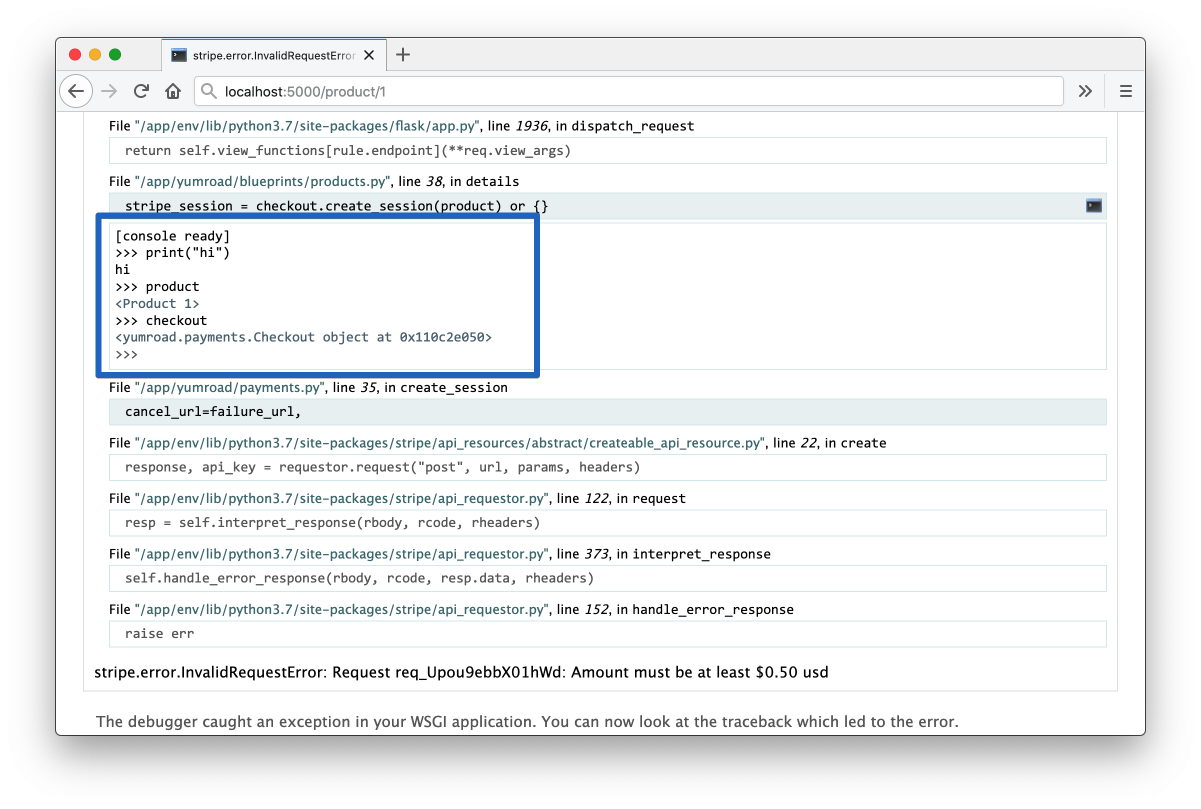
Once we hit the debugger pin, we can click on the debugger icon to open a session using the environment of that function up to that point in the code.
Error Monitoring in Production
These tools in our development environment help us quickly figure out what the context for errors are and fix it. In a production environment, you face a lot more challenges in trying to fix issues. For one thing, by default you wouldn't even know that error occurred or the context around how it was created unless a user reaches out to you and tells you. Then in order to pull up the traceback of the exception or error, you'd have to somehow connect to a production server and trawl through logs (if you were keeping them) to find what exactly happened. Once you find a fix and re-deploy it's hard to replicate since you don't know the exact data that a user provided to cause that error.
To solve this lack of visibility, developers use additional software specifically designed to monitor and track errors in production environments. There are a variety of tools that developers use, like Sentry, Rollbar, New Relic, Data Dog, among many more. Armin Ronacher, the creator of Flask and contributor to the ecosystem, actually works at Sentry and was their first engineering hire. Sentry is separately also an open source project and the core web service is written in Python. It seems fitting to use Sentry here, but it's also been my error tracking system of choice for the past seven years thanks to it's excellent UI and features that make it easy to resolve errors. While we'll focus on using Sentry here, the concepts & implementation for many of the other services I mention are similar.
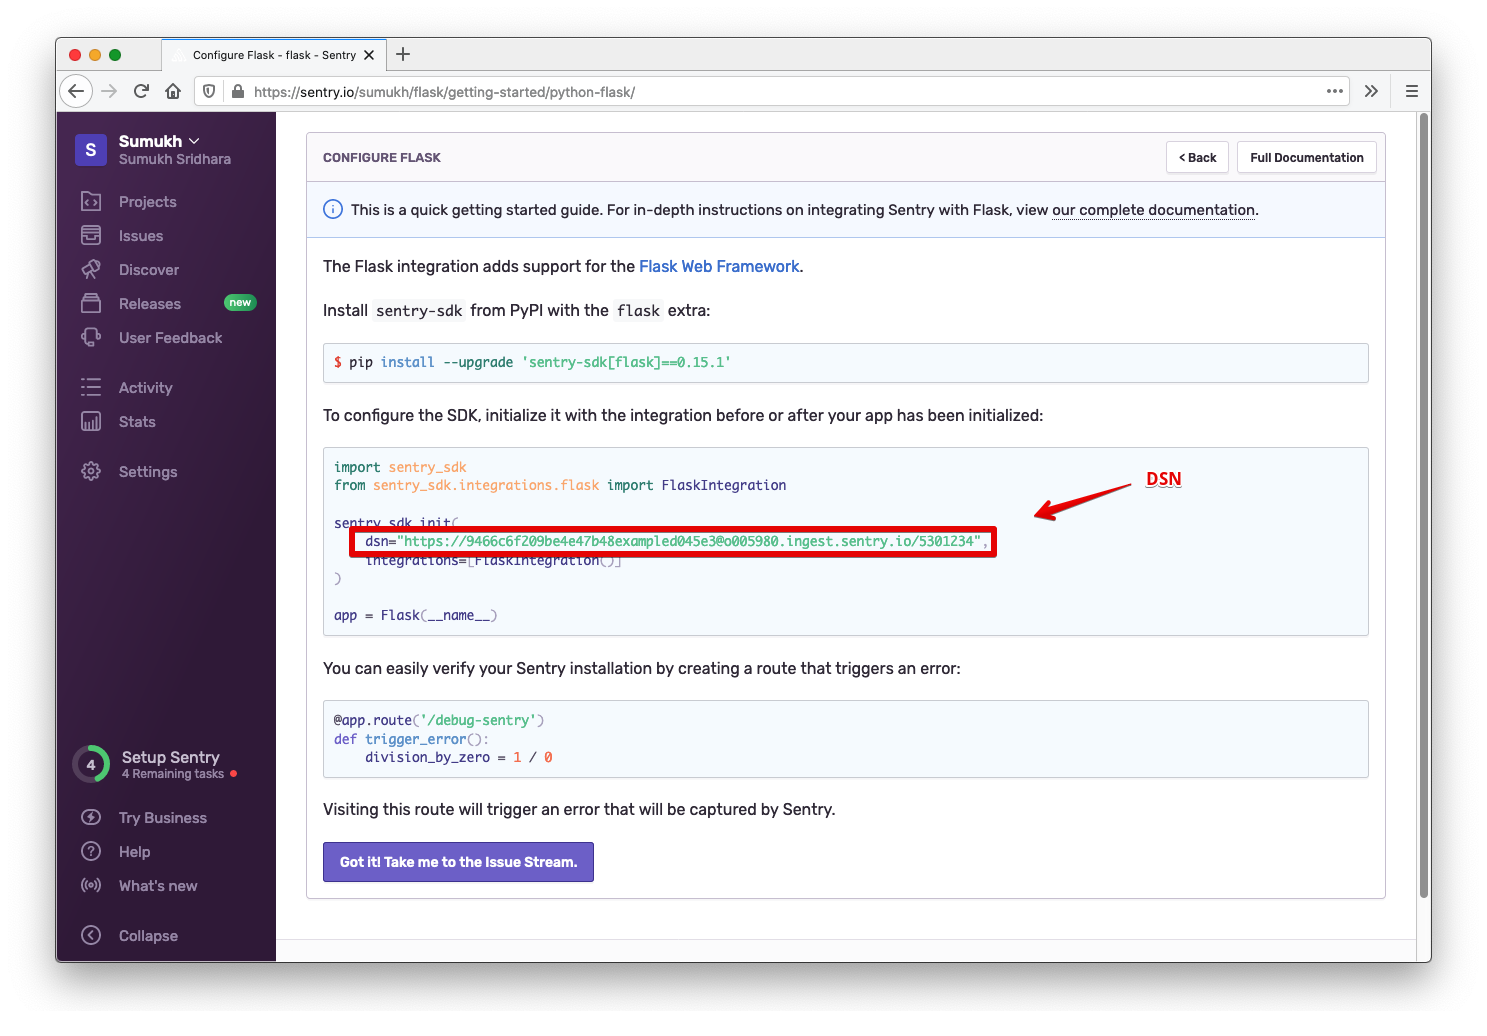
You can register for a free account at Sentry.io or host your instance using the open source Sentry repository. Once you register and create a project, you'll be provided with a configuration key called a DSN and setup instructions.
To get this configured, we will need to install the sentry Python package, but we'll also want to exclude specific Flask extension which we we can get by adding sentry[flask] to our requirements.txt file and then running pip install -r requirement.txt.
Then we need to specify our configuration key, which Sentry calls a DSN in our config.py file. For now to test the integration, we'll add it to the BaseConfig but it's often only added to the production config.
class BaseConfig:
    SENTRY_DSN = os.getenv('SENTRY_DSN')
Then in yumroad/__init__.py, we will initialize the SDK and tell it to observe both Flask and SQLAlchemy by specifying those as integrations for Sentry.
import sentry_sdk
from sentry_sdk.integrations.flask import FlaskIntegration
from sentry_sdk.integrations.sqlalchemy import SqlalchemyIntegration

def create_app(environment_name='dev'):
        ...
        if app.config.get("SENTRY_DSN"):
            sentry_sdk.init(
                dsn=app.config["SENTRY_DSN"],
                integrations=[FlaskIntegration(), SqlalchemyIntegration()]
            )
Unlike other libraries, we don't need to need to create an extension object as the Sentry Python integration is not a Flask extension. Sentry (through FlaskIntegration() hooks into different parts of Flask by itself using a feature of Flask called signals).
To test how this works, first add a route to your landing blueprint (yumroad/blueprints/landing.py) that will always raise an exception.
@landing_bp.route('/error')
def error():
    return 1/0
Then add your SENTRY_DSN to your environment (export SENTRY_DSN='...' in your terminal) and start a development server with flask run.
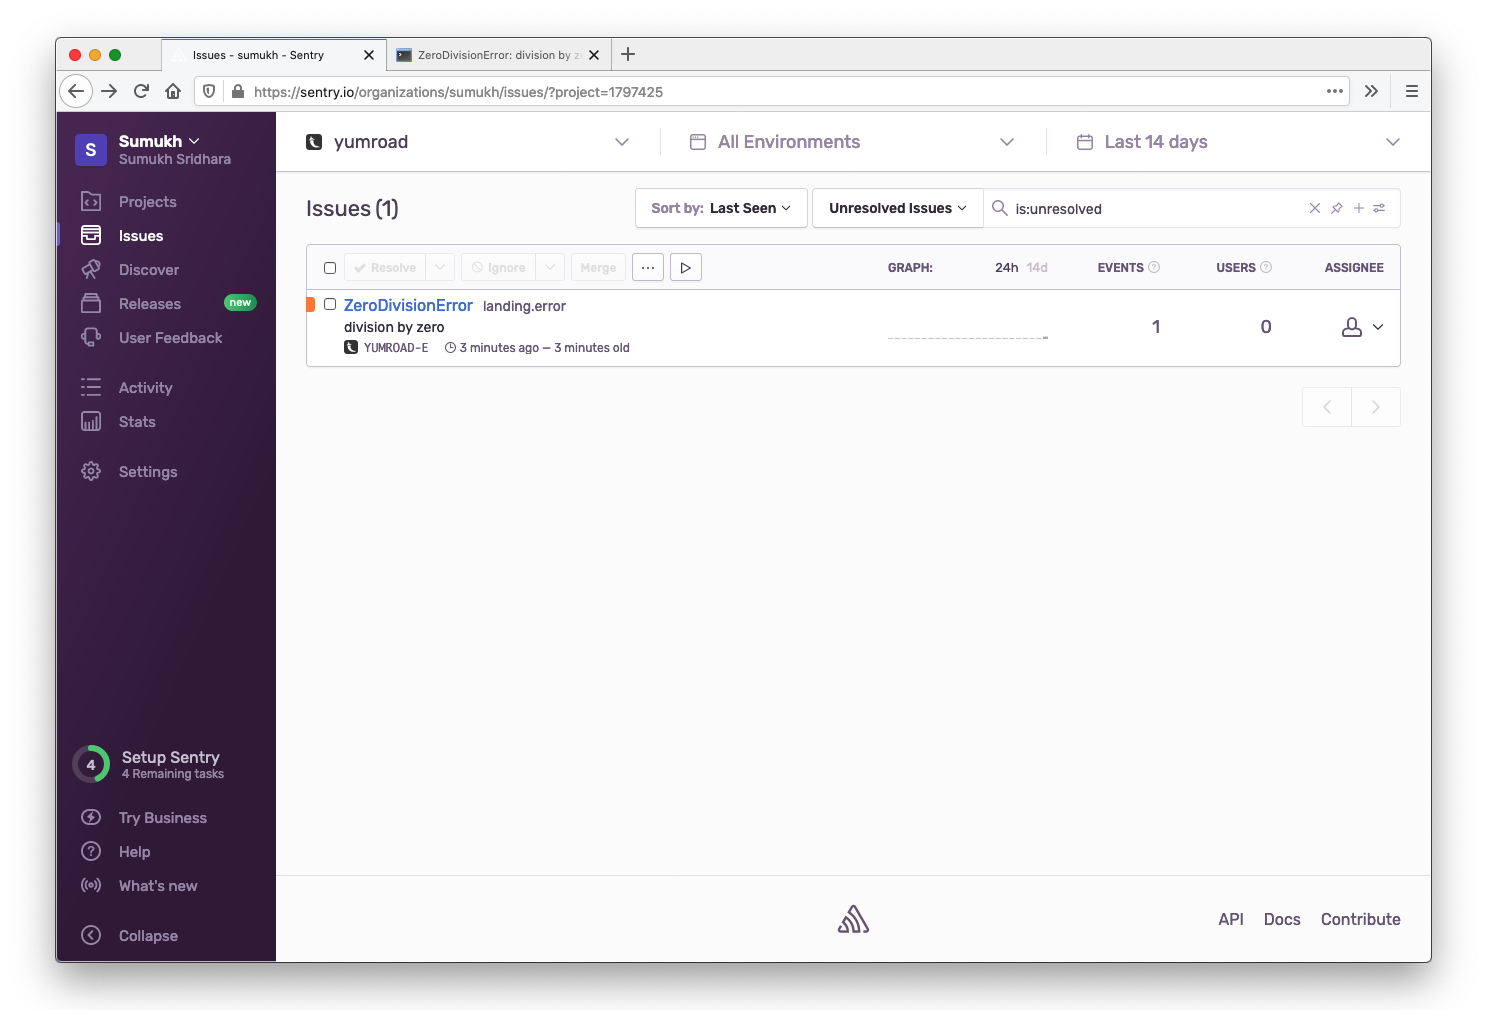
Loading http://localhost:5000/error, should give you a ZeroDivisionError error & backtrace. Now if you refresh your project in Sentry, you'll see the even show up in your issue log.
This lesson preview is part of the Fullstack Flask: Build a Complete SaaS App with Flask course and can be unlocked immediately with a single-time purchase. Already have access to this course? Log in here.
Get unlimited access to Fullstack Flask: Build a Complete SaaS App with Flask with a single-time purchase.

[00:00 - 00:12] As much as we might like it to be the case, and despite all of the testing we do, our code will likely have some errors. In large software projects, engineers often spend more time fixing or preventing bugs than actually building new features.
[00:13 - 00:29] So it's important to plan ahead for the developer experience if you want to create a maintainable flask application. To serve a production grade use case, it's important that you're able to understand what users have run into in production and store enough context so that you can debug it and find the root cause.
[00:30 - 00:50] In our local environment, we have access to debugger from worksurg, which is the local server for our flask. Worksurg is the WYSI utility file that flas uses to be a gateway interface to web servers.
[00:51 - 01:03] It comes with a bunch of utilities, one of which is a debugger. You've seen the debugger already, plenty of times in this course, and it occurs when the crash happens, but you might not have been able to see how to use it.
[01:04 - 01:14] So what we're going to do in this part of the course is we're going to play around with the debugger a little bit. What I'm going to do is in a part of our code, I'm going to go ahead and insert an error.
[01:15 - 01:31] So for example, I'm going to insert an error here where I'm going to raise, maybe just we'll just do one divided by zero or something or we'll raise an exception of some kind. All right, going back to Firefox, we can see what happens if we load the browser.
[01:32 - 01:51] We get the worksurg debugger page and we can see the full trace back to see where the error actually happened. Now one thing you can do is if you see this icon over here, you can actually click on this and this tells you a debugger, but it's locked with a console since it can let run arbitrary commands on your computer.
[01:52 - 02:01] So what you're going to do is you're going to go to your terminal and you're going to look at the debugger code here. So we're going to copy that debugger code, go back into Firefox and paste it in .
[02:02 - 02:13] Once we confirm the code, we can actually execute context within the scope of this file. So if I want, I can run stores and it'll tell me what stores are.
[02:14 - 02:22] And so I have all of the context that I need to be able to debug an application . And this is true at any level of the stack.
[02:23 - 02:31] So I can go in here and I can say what is self and what is self dot new functions, etc. And that's true throughout the stack.
[02:32 - 02:38] And that's just a really powerful debugger that you can use yourself. Okay.
[02:39 - 02:50] So let's go ahead and remove this editor we've used. Another thing you can do is you can actually configure VS code to be able to edit your application as well.
[02:51 - 03:04] There's an example of that in the SAS toolkit starter code that's included in the advance book. Nothing we're going to have to solve is error monitoring in production.
[03:05 - 03:17] So in production, we need to be able to find out a when an error happened as well as how to replicate it. If we don't have any visibility, we're going to have to rely on our users to report bugs to us.
[03:18 - 03:28] And that's not always consistent. So we can use what's called error monitoring software, such as sentry or roll bar, new relic, data dog, and there's a lot of other tools.
[03:29 - 03:41] Arm and Roneiture, the creator flask and core contributor to the ecosystem actually works at sentry and was their first engineering power. Sentry is also an open source project and the core web service is actually written in Python.
[03:42 - 03:58] So it seems fitting to use sentry here, but it's also been my error tracking system of choice for the past seven years, thanks to its excellent UI and features that make it easy to resolve errors. And in this course, we're going to focus on using sentry, but the concepts and implementation for many of the other services I mentioned are similar.
[03:59 - 04:11] You can create a free account at sentry.io. So if you go here, you'll be able to get your own account and use your own keys here.
[04:12 - 04:26] So to do that, we're going to install sentry SDK and specify that we want the flask settings there. Now in order to get a sentry account and register our project, we're going to have to go to the sentry dashboard.
[04:27 - 04:32] Okay, you're in sentry. What we're going to do is we're going to create a new project and we're going to call this yumroad-app.
[04:33 - 04:40] When we create the project, it's going to give us this setup instructions. So we're going to copy this bsn.
[04:41 - 04:50] We're going to need it in a little bit. I'm actually just going to go ahead and set that right now as our sentry, dsn.
[04:51 - 04:57] Oops. Great.
[04:58 - 05:09] Now in our config, I'm going to go ahead and set that as well. That sentry dsn is equal to a list dot get n of sentry dsn.
[05:10 - 05:14] Perfect. Now we're going to have to install sentry to our application.
[05:15 - 05:28] We can do that by following the instructions that sentry provides us here. So we can say import sentry sdk and from sentry integrations import flask.
[05:29 - 05:40] So we're going to go there and go ahead and add those two. Now next one is we're going to copy this sentry initialization.
[05:41 - 05:49] But instead of hard coding the string here, let's go ahead and grab it from the configs. We're going to say app dot config sentry dsn.
[05:50 - 06:04] And one thing we can do is we can say only do this if the sentry dsn is defined . So if app dot config dot get sentry dsn, run this.
[06:05 - 06:09] Okay. Now what we can do is we can go ahead and trigger an error in our application.
[06:10 - 06:16] So I'm going to go to the landing page. And again, I'm going to do something that will cause an error like that.
[06:17 - 06:20] Okay. Going back to Firefox, let's go and see what happens if I go here.
[06:21 - 06:26] You have this zero division error. Now we can go and check in sentry if that error showed up.
[06:27 - 06:31] Okay. So as soon as I loaded the issue stream, I saw that the error showed up here.
[06:32 - 06:45] And so here we can see a lot of things around zero division error, the exact trace back, the system environment, the browser that triggered this error among a bunch of other things. And it's really useful to be able to debug this information.
[06:46 - 06:53] In addition, it's also giving us the logs that were run. So since we've turned SQL, I mean logging on, it's storing that log as well.
[06:54 - 07:03] There's a bunch of other parameters here that is useful. So as you can see, sentry is super useful to helping us debug errors in production.
[07:04 - 07:07] We can also import logging into our application. So sentry captures that information.
[07:08 - 07:21] So if we wanted to log something, we could just import the logging library that 's built into Python and define a logger. So here, you can say our logger is equal to logging.
[07:22 - 07:33] Get logger and we'll pass the module name. Then here we can just do logger.warning something that is about to happen.
[07:34 - 07:39] And then we can return one divided by zero. And if we did that, our data would show up.
[07:40 - 07:47] We can also pass some data into the logger. So we can say extra is equal to data and we can pass some information here.
[07:48 - 07:52] OK, so that's logging. And sentry is going to capture that information as well.
[07:53 - 08:10] And the other thing we can do is we can capture the user information of people who are logged in. And so if your data retention policies allow you to do this, what you can do is you can actually tell sentry SDK to send the default, personally identifiable information here.
[08:11 - 08:20] Another thing we can do is also look at the SQL alchemy integration. The SQL alchemy integration will help us look at specific models as well in queries that are happening.
[08:21 - 08:30] Sentry already knows about Flask login. So it's actually going to already look at that information.
[08:31 - 08:45] And if the user is logged in, it's going to go ahead and tell us that on the landing page if the user is logged in here, which is really cool. Again, you're going to have to consult your data retention policies to see whether or not you can't do that.
[08:46 - 08:56] OK, last one is to catch errors, we're going to want to catch a lot of these errors. So for example, if we get 401 errors, we're going to want to not show the default error.
[08:57 - 09:12] So error handler 401 and what we want to do is say unauthorized access. And in this case, we want to render some kind of error template.
[09:13 - 09:22] So we can say this is going to be a 401 error that we're going to render as a 401. And then similarly, we can do that for 404s globally as well as 500s.
[09:23 - 09:26] So this is for 404. And then this is for 500.
[09:27 - 09:41] Then we can go ahead and create those within the templates folder. OK, here's one for the 401 error.
[09:42 - 09:46] It just says that they're unauthorized. And then for the 404 error, we can do something similar.
[09:47 - 09:55] It says not found. And then for the 500 error, we can just say that there has been an error.
[09:56 - 10:15] All right, so we now have full error capturing and error handling for our application. Now if we go and run our tests, we're going to see that these routes are not actually tested.
[10:16 - 10:27] So we can add some tests for these as well. Another thing we're going to have to do is import render template here.
[10:28 - 10:35] Because we are now rendering templates in this file. We also called our templates folder errors.
[10:36 - 10:43] So let's go and fix that too. And now let's go ahead and reload our browser and see what happens on our page.
[10:44 - 10:50] So then it says something much nicer like we can find that page. And it takes us back to a better page.
[10:51 - 10:57] So that's a lot nicer of an error message. Now we might not want to test any pages that have a 401 or a 500 code.
[10:58 - 11:03] So we're going to mark those as not needing to be covered. But the 400 page, there is a place where we test that.
[11:04 - 11:12] And that's in test product.py. Test product.py, however, renders its own custom error handler, if you recall.
[11:13 - 11:21] It defines its own error handler here. So we're all good on that front, which means we're not also not going to test.
[11:22 - 11:28] It for products, but on stores, we might want to test it. So let's go and test the store page here.
[11:29 - 11:34] Then we'll just test the test of our test store 404. So we're creating a page that shouldn't exist.
[11:35 - 11:41] And we're asserting that the 404 will pop up. And once we run our tests, we'll see that everything passes.
[11:42 - 11:48] It might be useful to also run our code coverage metrics and ensure that we're still at 100% code coverage. So we can do that.
[11:49 - 11:59] Great. It looks like we're still at 100% code coverage.